Edit chart
Loading graph
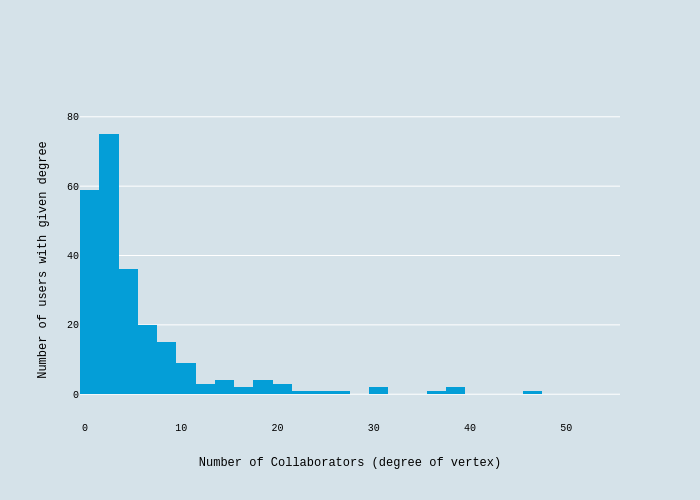
Poovey's interactive graph and data of "Number of users with given degree vs Number of Collaborators (degree of vertex)" is a histogram, showing Col1; with Number of Collaborators (degree of vertex) in the x-axis and Number of users with given degree in the y-axis.. The x-axis shows values from -0.512204303837822 to 55.5914534444759. The y-axis shows values from -7.433137484219948 to 84.84261539129606.