Edit chart
Loading graph
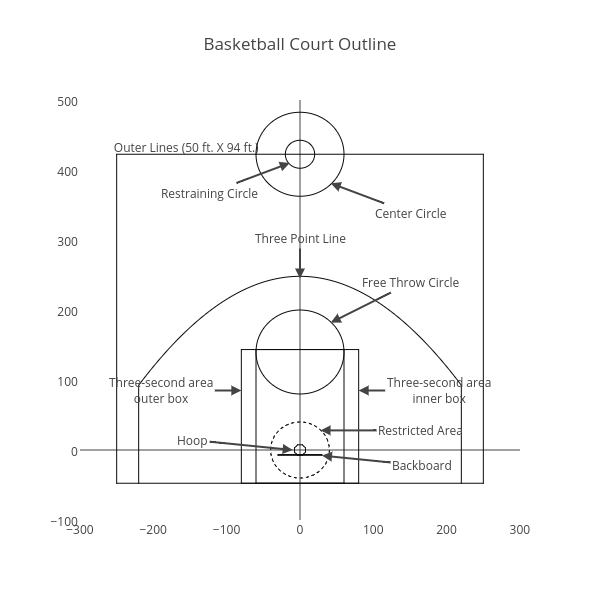
Pravj's interactive graph and data of "Basketball Court Outline" is a . The x-axis shows values from -300 to 300. The y-axis shows values from -100 to 500. This visualization has the following annotations: Hoop; Backboard; Restricted Area; Three Point Line; Three-second areaouter box; Three-second areainner box; Free Throw Circle; Center Circle; Restraining Circle