Edit chart
Loading graph
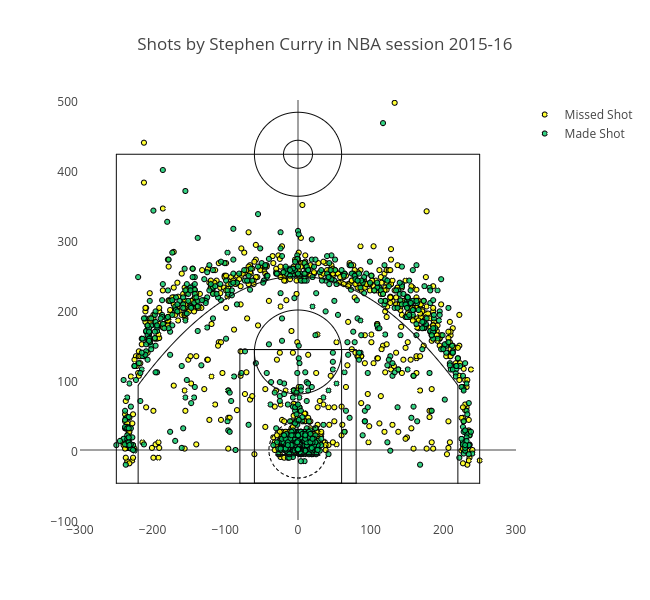
Pravj's interactive graph and data of "Shots by Stephen Curry in NBA session 2015-16" is a scatter chart, showing Missed Shot vs Made Shot. The x-axis shows values from -300 to 300. The y-axis shows values from -100 to 500.