Edit chart
Loading graph
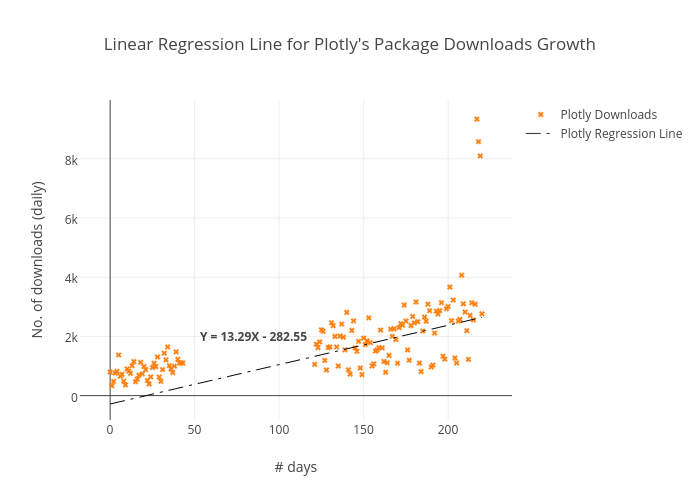
Pravj's interactive graph and data of "Linear Regression Line for Plotly's Package Downloads Growth" is a scatter chart, showing Plotly Downloads, Plotly Downloads, Plotly Regression Line; with # days in the x-axis and No. of downloads (daily) in the y-axis.. The x-axis shows values from -13.23500165727544 to 233.23500165727543. The y-axis shows values from -822.5305806444334 to 9976.952256409579. This visualization has the following annotation: Y = 13.29X - 282.55