Edit chart
Loading graph
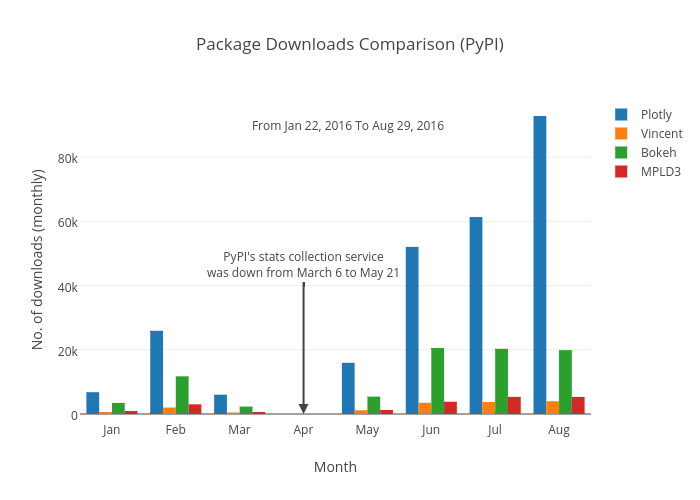
Pravj's interactive graph and data of "Package Downloads Comparison (PyPI)" is a grouped bar chart, showing Plotly, Vincent, Bokeh, MPLD3; with Month in the x-axis and No. of downloads (monthly) in the y-axis.. The x-axis shows values from -0.5 to 7.5. The y-axis shows values from -1715.5822550831795 to 97788.18853974123. This visualization has the following annotations: PyPI's stats collection servicewas down from March 6 to May 21; From Jan 22, 2016 To Aug 29, 2016