Edit chart
Loading graph
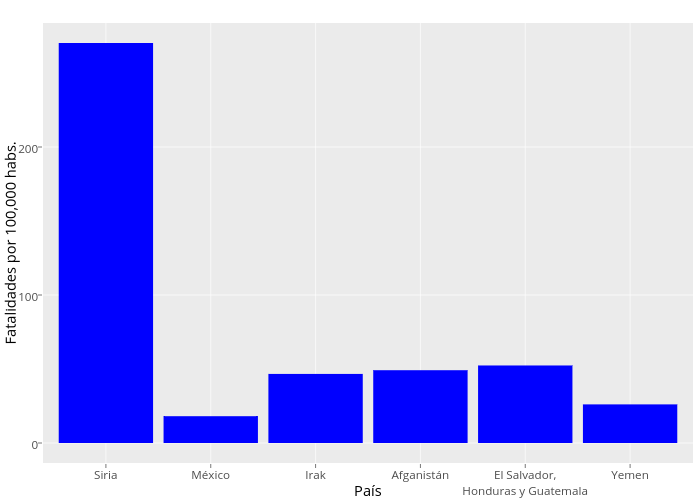
Prestevez's interactive graph and data of "Fatalidades por 100,000 habs. vs País" is a bar chart; with País in the x-axis and Fatalidades por 100,000 habs. in the y-axis.. The x-axis shows values from 0.4 to 6.6. The y-axis shows values from -13.5135135135135 to 283.783783783784.