Edit chart
Loading graph
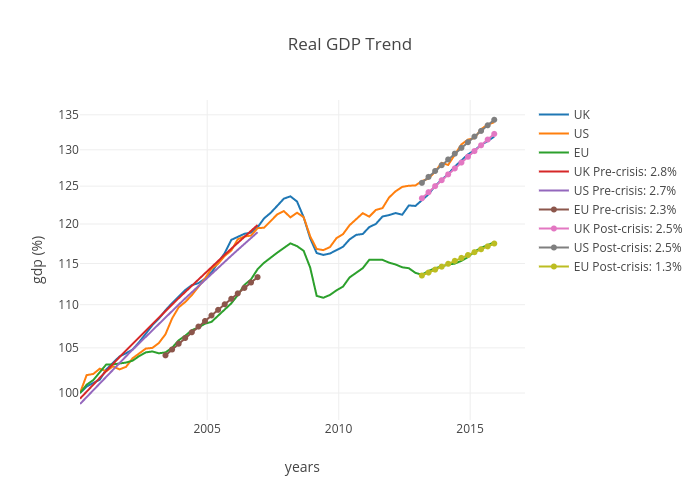
Prodiptag's interactive graph and data of "Real GDP Trend" is a scatter chart, showing UK, US, EU, UK Pre-crisis: 2.8%, US Pre-crisis: 2.7%, EU Pre-crisis: 2.3%, UK Post-crisis: 2.5%, US Post-crisis: 2.5%, EU Post-crisis: 1.3%; with years in the x-axis and gdp (%) in the y-axis.. The x-axis shows values from 0 to 0. The y-axis shows values from 0 to 0.