Edit chart
Loading graph
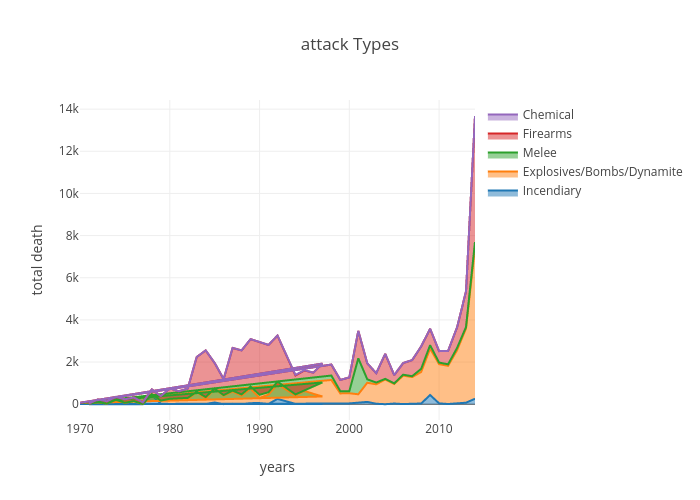
Prodiptag's interactive graph and data of "attack Types" is a filled scatter chart, showing Incendiary, Explosives/Bombs/Dynamite, Melee, Firearms, Chemical; with years in the x-axis and total death in the y-axis.. The x-axis shows values from 0 to 0. The y-axis shows values from 0 to 0.