Edit chart
Loading graph
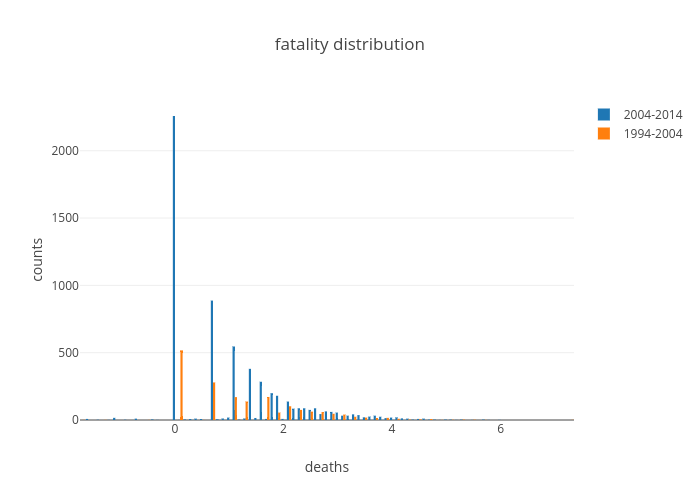
Prodiptag's interactive graph and data of "fatality distribution" is a histogram, showing 2004-2014 vs 1994-2004; with deaths in the x-axis and counts in the y-axis.. The x-axis shows values from -1.749999999999997 to 7.350000000000001. The y-axis shows values from 0 to 2376.842105263158.