Edit chart
Loading graph
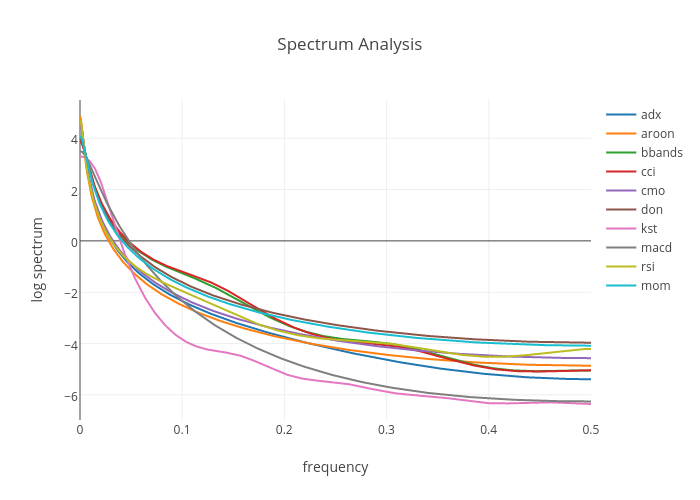
Prodiptag's interactive graph and data of "Spectrum Analysis" is a scatter chart, showing adx, aroon, bbands, cci, cmo, don, kst, macd, rsi, mom; with frequency in the x-axis and log spectrum in the y-axis.. The x-axis shows values from 0 to 0. The y-axis shows values from 0 to 0.