Edit chart
Loading graph
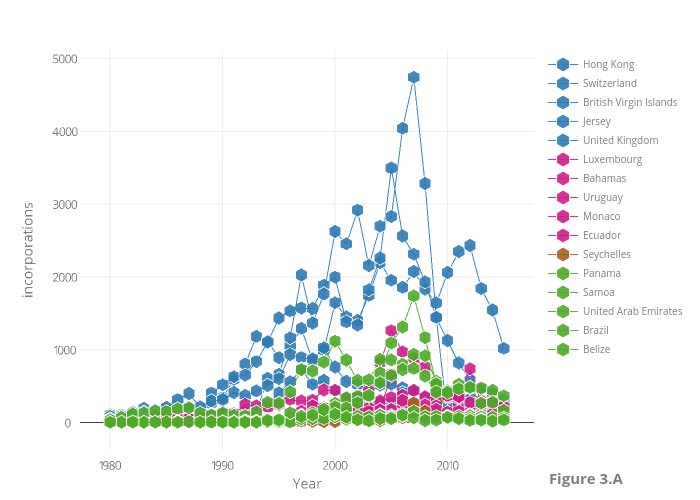
Puccife's interactive graph and data of "incorporations vs Year" is a scattergl, showing Hong Kong, Switzerland, British Virgin Islands, Jersey, United Kingdom, Luxembourg, Bahamas, Uruguay, Monaco, Ecuador, Seychelles, Panama, Samoa, United Arab Emirates, Brazil, Belize; with Year in the x-axis and incorporations in the y-axis.. The x-axis shows values from 1977.5438596491229 to 2017.4561403508771. The y-axis shows values from -501.5151515151515 to 5241.515151515152. This visualization has the following annotation: Figure 3.A