Edit chart
Loading graph
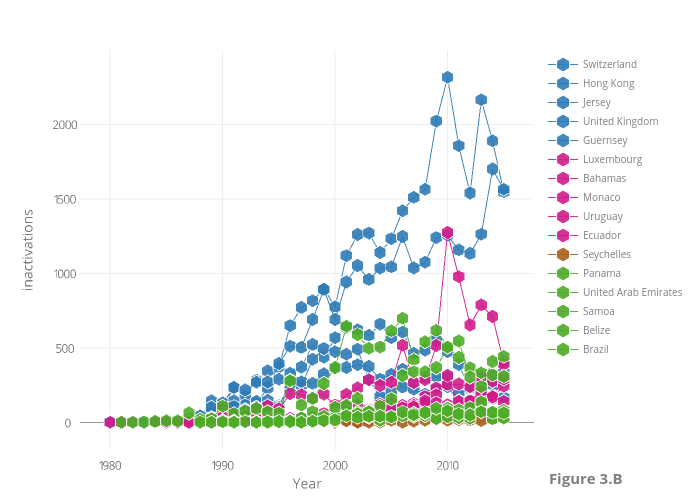
Puccife's interactive graph and data of "inactivations vs Year" is a scattergl, showing Switzerland, Hong Kong, Jersey, United Kingdom, Guernsey, Luxembourg, Bahamas, Monaco, Uruguay, Ecuador, Seychelles, Panama, United Arab Emirates, Samoa, Belize, Brazil; with Year in the x-axis and inactivations in the y-axis.. The x-axis shows values from 1977.6124278334853 to 2017.3875721665147. The y-axis shows values from -175.7566960104889 to 2490.7566960104887. This visualization has the following annotation: Figure 3.B