Edit chart
Loading graph
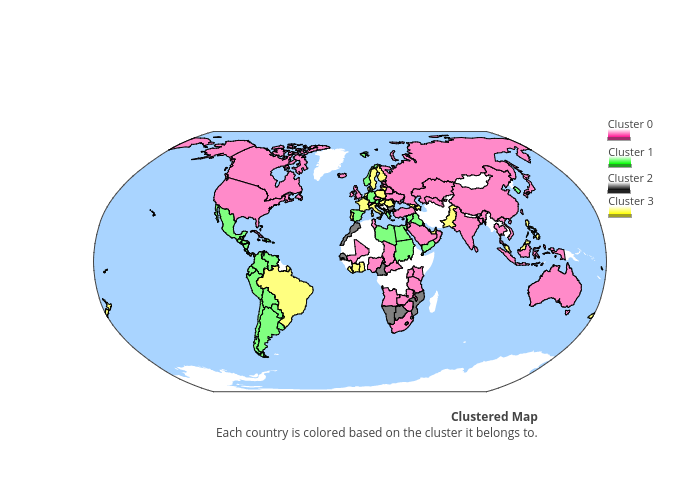
Puccife's interactive graph and data of "Cluster 0, Cluster 1, Cluster 2, Cluster 1, z" is a choropleth, showing Cluster 0, Cluster 1, Cluster 2, Cluster 1, z. The x-axis shows values from 0.19995910577971648 to 0.20123137041075972. The y-axis shows values from 0.7470914127423822 to 0.8529085872576178. This visualization has the following annotation: Clustered MapEach country is colored based on the cluster it belongs to.