Edit chart
Loading graph
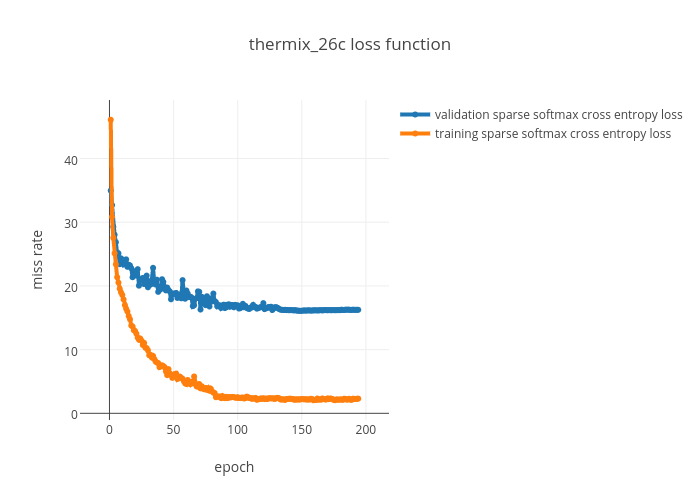
Pusiol's interactive graph and data of "thermix_26c loss function" is a line chart, showing validation sparse softmax cross entropy loss vs training sparse softmax cross entropy loss; with epoch in the x-axis and miss rate in the y-axis.. The x-axis shows values from -15.99806736609608 to 210.99806736609608. The y-axis shows values from -0.9093797150041918 to 49.04937971500419.