Edit chart
Loading graph
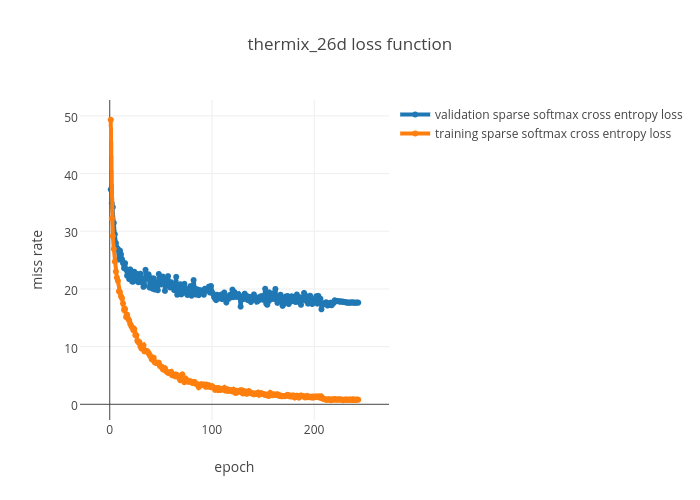
Pusiol's interactive graph and data of "thermix_26d loss function" is a line chart, showing validation sparse softmax cross entropy loss vs training sparse softmax cross entropy loss; with epoch in the x-axis and miss rate in the y-axis.. The x-axis shows values from 0 to 0. The y-axis shows values from 0 to 0.