Edit chart
Loading graph
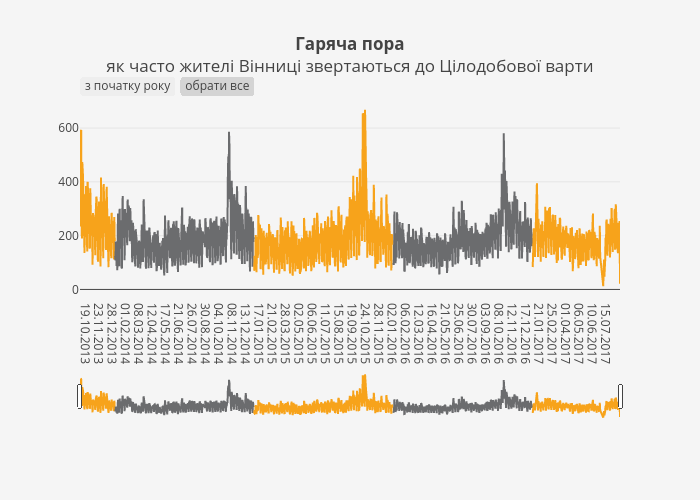
Quaz's interactive graph and data of "Гаряча пораяк часто жителі Вінниці звертаються до Цілодобової варти" is a line chart, showing 2013, 2014, 2015, 2016, 2017; with time in the x-axis. The x-axis shows values from 0 to 0. The y-axis shows values from 0 to 0.