Edit chart
Loading graph
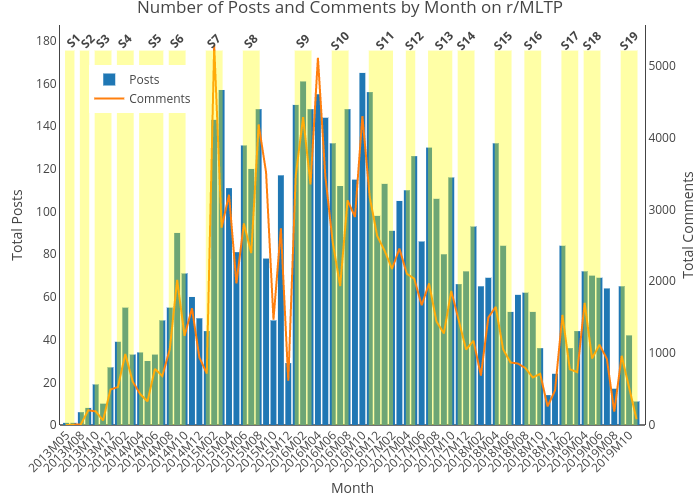
Quibbly's interactive graph and data of "Number of Posts and Comments by Month on r/MLTP" is a bar chart, showing Posts vs Comments; with Month in the x-axis and Total Posts in the y-axis.. The x-axis shows values from 0 to 0. The y-axis shows values from 0 to 0. This visualization has the following annotations: S1; S2; S3; S4; S5; S6; S7; S8; S9; S10; S11; S12; S13; S14; S15; S16; S17; S18; S19