Edit chart
Loading graph
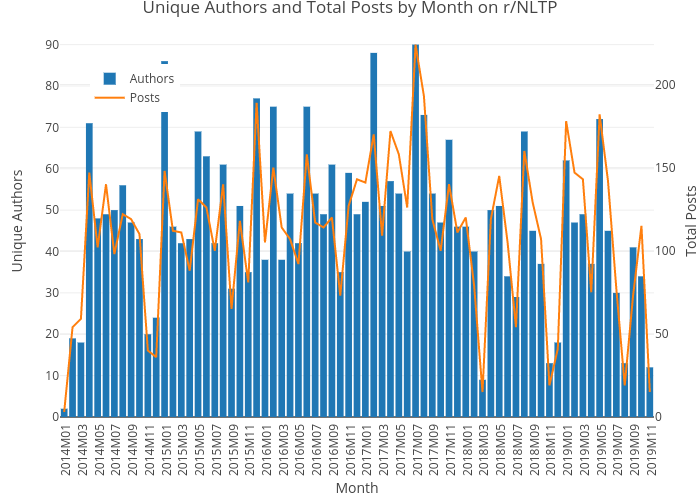
Quibbly's interactive graph and data of "Unique Authors and Total Posts by Month on r/NLTP" is a bar chart, showing Authors vs Posts; with Month in the x-axis and Unique Authors in the y-axis.. The x-axis shows values from 0 to 0. The y-axis shows values from 0 to 0.