Edit chart
Loading graph
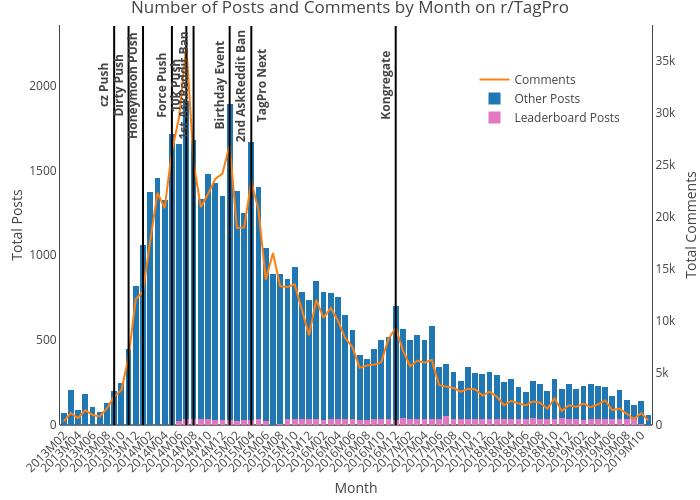
Quibbly's interactive graph and data of "Number of Posts and Comments by Month on r/TagPro" is a stacked bar chart, showing Leaderboard Posts, Other Posts, Comments; with Month in the x-axis and Total Posts in the y-axis.. The x-axis shows values from 0 to 0. The y-axis shows values from 0 to 0. This visualization has the following annotations: cz Push; Dirty Push; Honeymoon PUsh; Force Push; 10k Push; 1st AskReddit Ban; Birthday Event; 2nd AskReddit Ban; TagPro Next; Kongregate