Edit chart
Loading graph
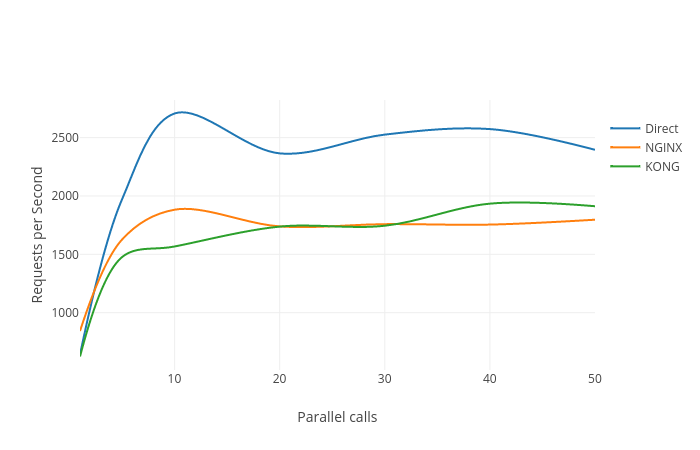
R1ckr's interactive graph and data of "Requests per Second vs Parallel calls" is a line chart, showing Direct, NGINX, KONG; with Parallel calls in the x-axis and Requests per Second in the y-axis.. The x-axis shows values from 1 to 50. The y-axis shows values from 508.7638888888889 to 2822.4861111111113.