Edit chart
Loading graph
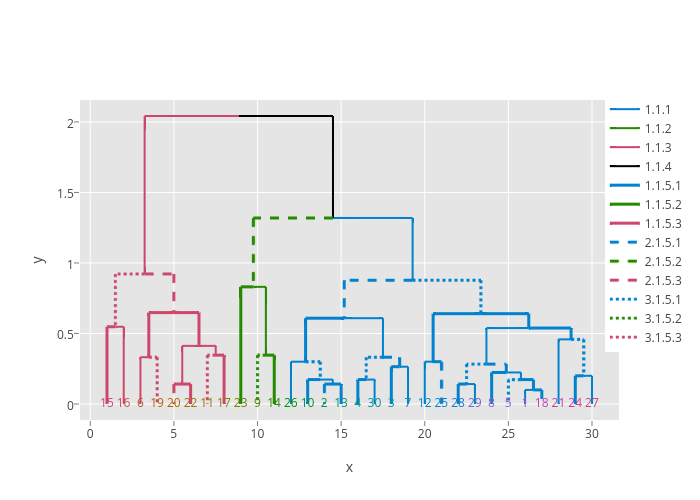
R_user_guide's interactive graph and data of "y vs x" is a line chart, showing 1.1.1, 1.1.2, 1.1.3, 1.1.4, 1.1.5.1, 1.1.5.2, 1.1.5.3, 2.1.5.1, 2.1.5.2, 2.1.5.3, 3.1.5.1, 3.1.5.2, 3.1.5.3, #0082CE, #008AC4, #008E00, #008FB7, #009232, #0093A7, #009453, #00956B, #009595, #009681, #1678D5, #228B00, #518600, #636CD8, #6C8200, #807C00, #895FD7, #917600, #9F7000, #A352D1, #AC6900, #B646C7, #B76100, #BF592D, #C33DBA, #C75051, #CB39AA, #CC476B, #CE3A97, #CE4082; with x in the x-axis and y in the y-axis.. The x-axis shows values from -0.6111111111111114 to 31.61111111111111. The y-axis shows values from -0.1134476547592341 to 2.1555054404254483.