Edit chart
Loading graph
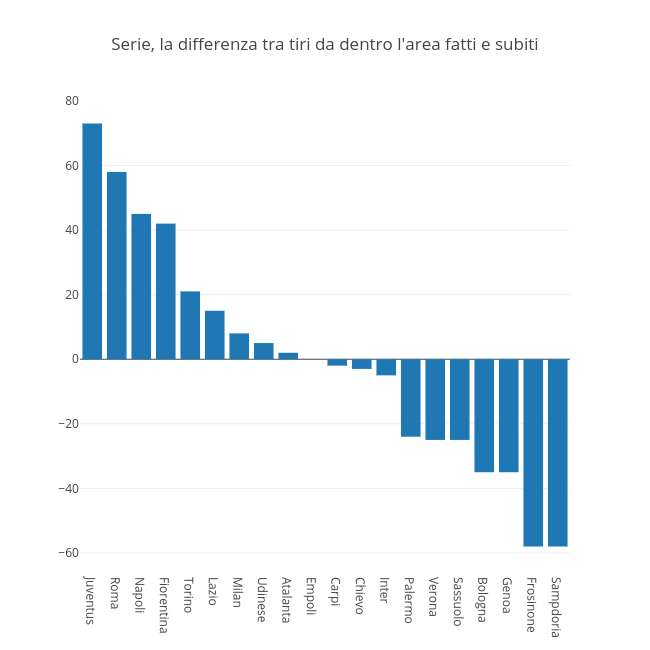
Raffo's interactive graph and data of "Serie, la differenza tra tiri da dentro l'area fatti e subiti" is a bar chart, showing Col2. The x-axis shows values from -0.5 to 19.5. The y-axis shows values from -65.27777777777777 to 80.27777777777777.