Edit chart
Loading graph
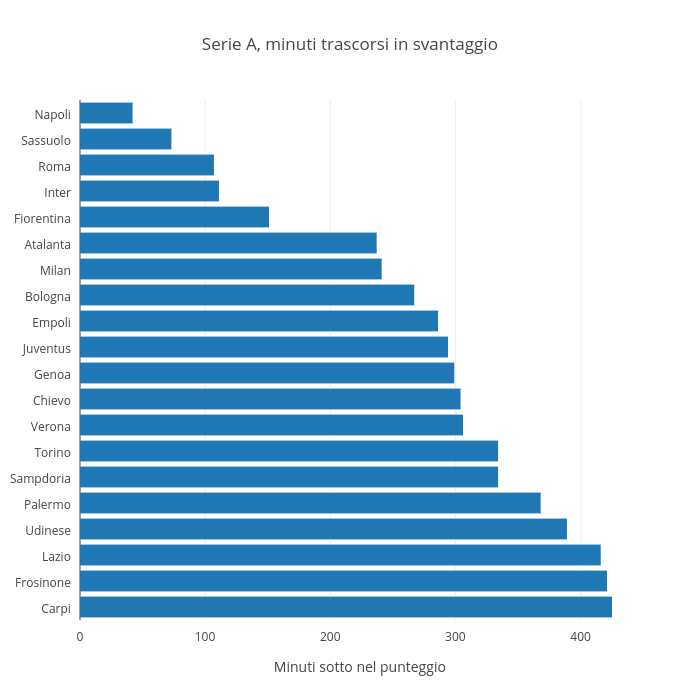
Raffo's interactive graph and data of "Serie A, minuti trascorsi in svantaggio" is a bar chart, showing Minuti sotto; with Minuti sotto nel punteggio in the x-axis. The x-axis shows values from 0 to 447.36842105263156. The y-axis shows values from -0.5 to 19.5.