Edit chart
Loading graph
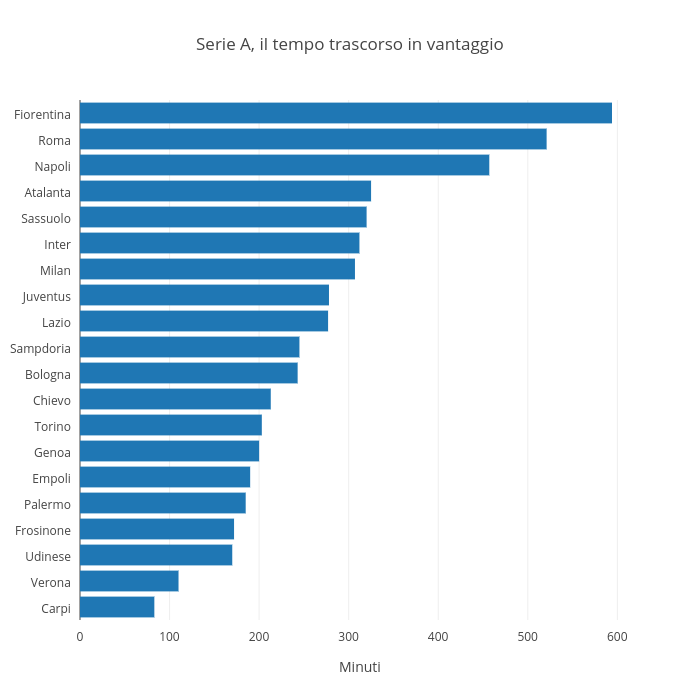
Raffo's interactive graph and data of "Serie A, il tempo trascorso in vantaggio" is a bar chart, showing Col2; with Minuti in the x-axis. The x-axis shows values from 0 to 625.2631578947369. The y-axis shows values from -0.5 to 19.5.