Edit chart
Loading graph
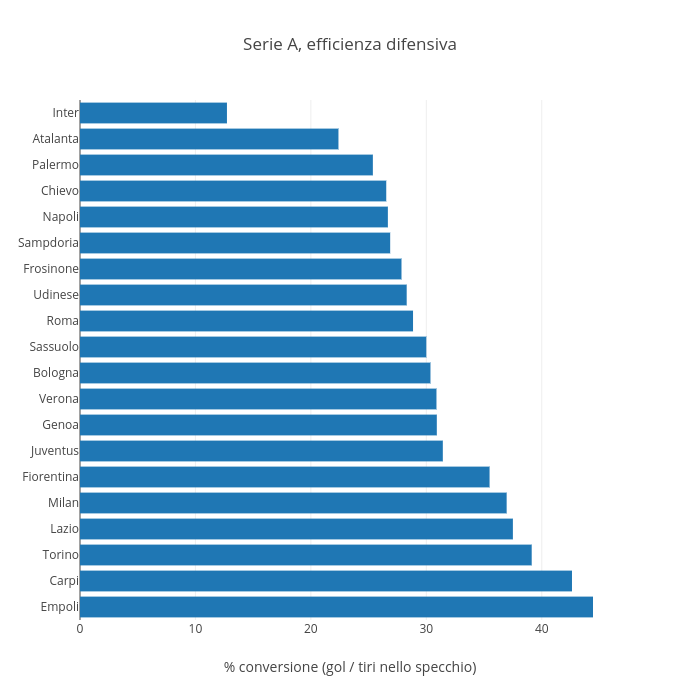
Raffo's interactive graph and data of "Serie A, efficienza difensiva" is a bar chart, showing % conversione; with % conversione (gol / tiri nello specchio) in the x-axis. The x-axis shows values from 0 to 46.77894736842105. The y-axis shows values from -0.5 to 19.5.