Edit chart
Loading graph
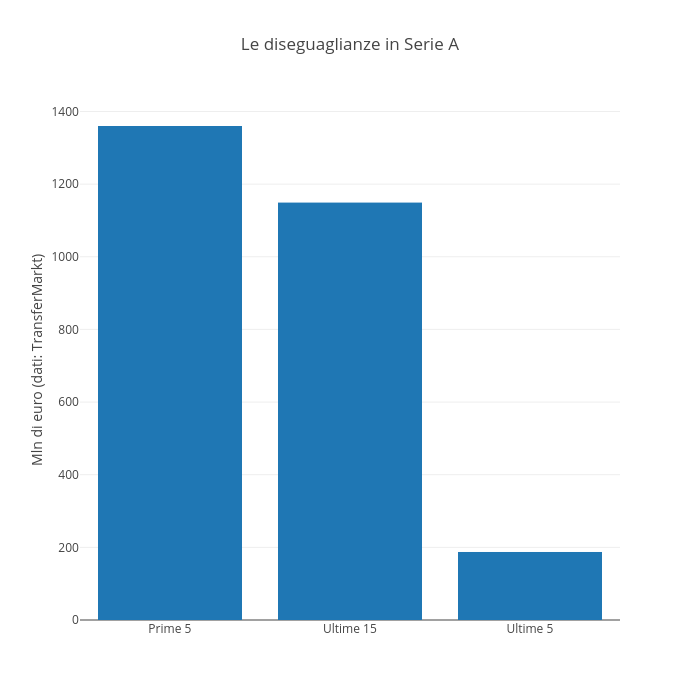
Raffo's interactive graph and data of "Le diseguaglianze in Serie A" is a bar chart, showing Col2; with Mln di euro (dati: TransferMarkt) in the y-axis. The x-axis shows values from -0.5 to 2.5. The y-axis shows values from 0 to 1431.5578947368422.