Edit chart
Loading graph
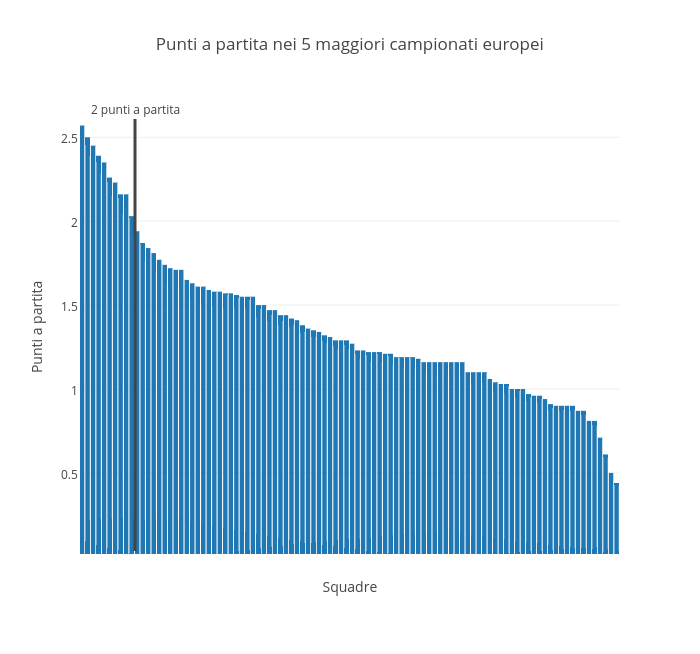
Raffo's interactive graph and data of "Punti a partita nei 5 maggiori campionati europei" is a bar chart, showing Col2; with Squadre in the x-axis and Punti a partita in the y-axis.. The x-axis shows values from -0.37662417994322084 to 97.62337582005674. The y-axis shows values from 0.016841964995843783 to 2.7221051228905795. This visualization has the following annotations: 2 punti; 2 punti a partita