Edit chart
Loading graph
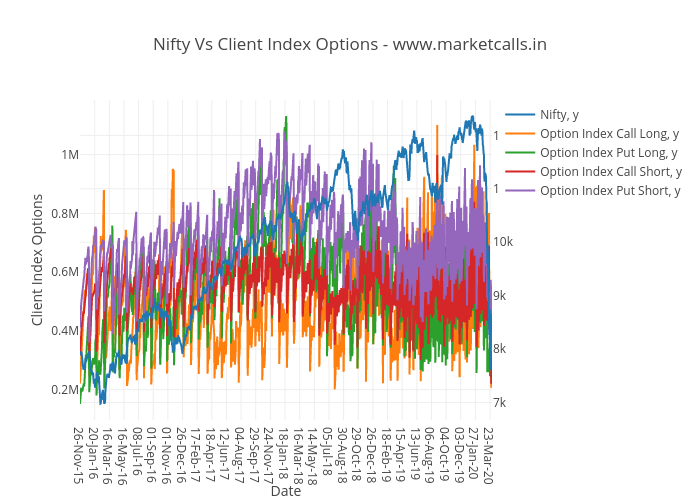
Rajandran's interactive graph and data of "Nifty Vs Client Index Options - www.marketcalls.in" is a line chart, showing Nifty, y, Option Index Call Long, y, Option Index Put Long, y, Option Index Call Short, y, Option Index Put Short, y; with Date in the x-axis and Client Index Options in the y-axis.. The x-axis shows values from 0 to 1069. The y-axis shows values from 96868.66666666667 to 1186095.3333333333.