Edit chart
Loading graph
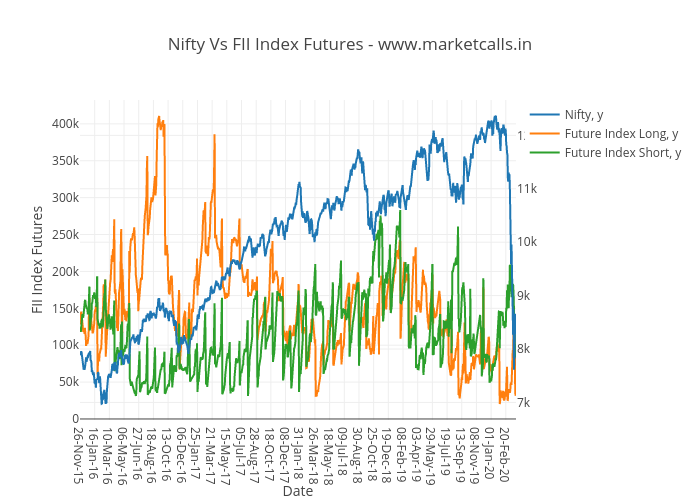
Rajandran's interactive graph and data of "Nifty Vs FII Index Futures - www.marketcalls.in" is a line chart, showing Nifty, y, Future Index Long, y, Future Index Short, y; with Date in the x-axis and FII Index Futures in the y-axis.. The x-axis shows values from 0 to 1069. The y-axis shows values from -1388.1666666666642 to 432335.1666666667.