Edit chart
Loading graph
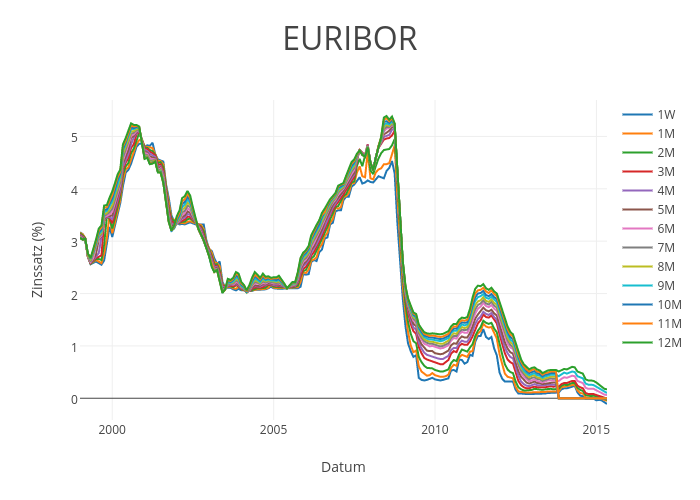
Ralph.thaller's interactive graph and data of "EURIBOR" is a scatter chart, showing 1W, 1M, 2M, 3M, 4M, 5M, 6M, 7M, 8M, 9M, 10M, 11M, 12M; with Datum in the x-axis and Zinssatz (%) in the y-axis.. The x-axis shows values from 915145200000 to 1430431200000. The y-axis shows values from -0.4155555555555556 to 5.695555555555555.