Edit chart
Loading graph
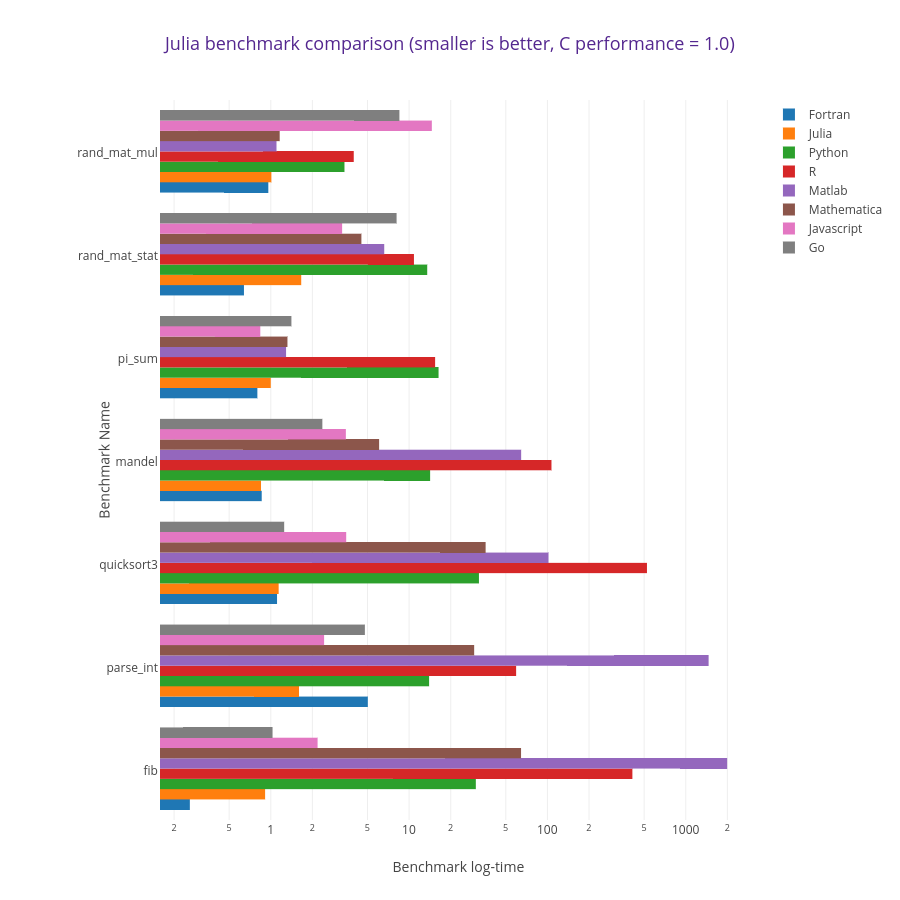
Randyzwitch's interactive graph and data of "Julia benchmark comparison (smaller is better, C performance = 1.0)" is a grouped bar chart, showing Fortran, Julia, Python, R, Matlab, Mathematica, Javascript, Go; with Benchmark log-time in the x-axis and Benchmark Name in the y-axis.. The x-axis shows values from 0 to 0. The y-axis shows values from 0 to 0.