Edit chart
Loading graph
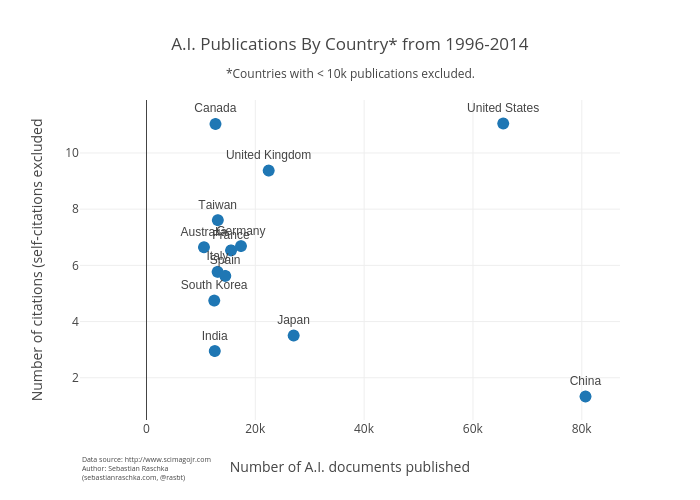
Rasbt's interactive graph and data of "A.I. Publications By Country* from 1996-2014" is a ; with Number of A.I. documents published in the x-axis and Number of citations (self-citations excluded in the y-axis.. The x-axis shows values from 0 to 0. The y-axis shows values from 0 to 0. This visualization has the following annotations: Data source: http://www.scimagojr.comAuthor: Sebastian Raschka(sebastianraschka.com, @rasbt); *Countries with < 10k publications excluded.