Edit chart
Loading graph
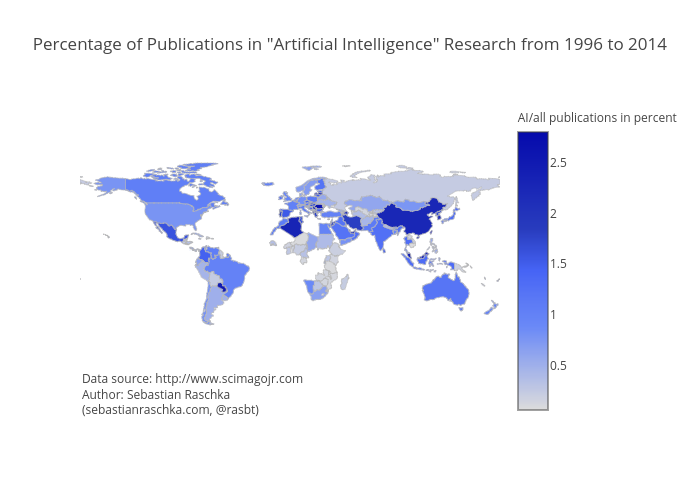
Rasbt's interactive graph and data of "Percentage of Publications in "Artificial Intelligence" Research from 1996 to 2014" is a choropleth. The x-axis shows values from 0 to 0. The y-axis shows values from 0 to 0. This visualization has the following annotation: Data source: http://www.scimagojr.comAuthor: Sebastian Raschka(sebastianraschka.com, @rasbt)