Edit chart
Loading graph
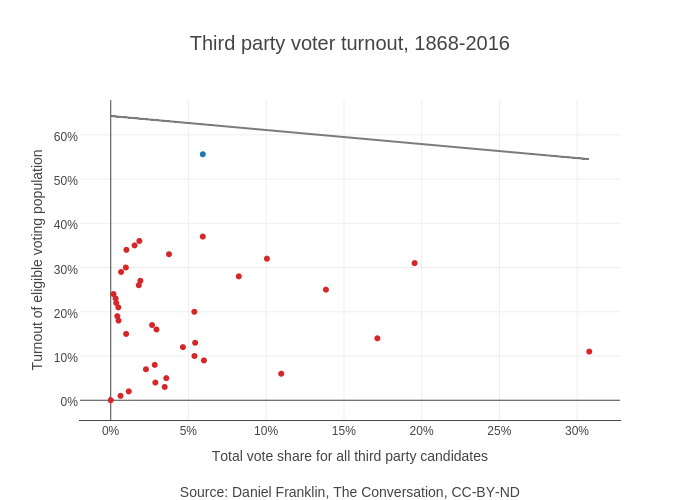
Realavivahr's interactive graph and data of "Third party voter turnout, 1868-2016" is a scatter chart, showing turnout, turnout, B; with Total vote share for all third party candidatesSource: Daniel Franklin, The Conversation, CC-BY-ND in the x-axis and Turnout of eligible voting population in the y-axis.. The x-axis shows values from -2.039103732303732 to 32.817503732303734. The y-axis shows values from 46.52718360071301 to 84.97281639928698.