Edit chart
Loading graph
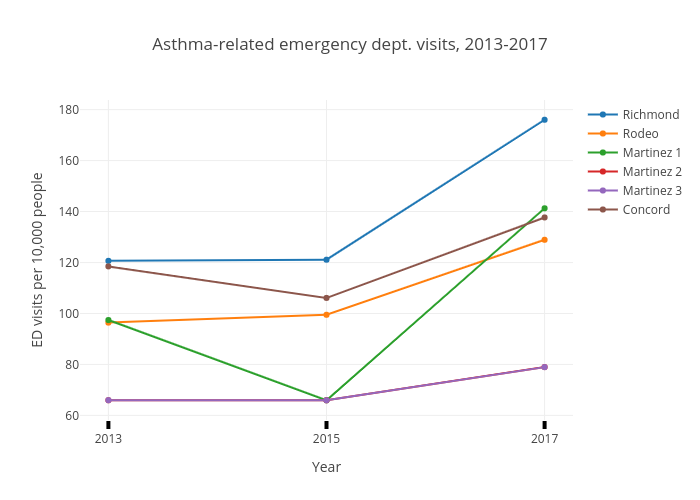
Reinarau's interactive graph and data of "Asthma-related emergency dept. visits, 2013-2017" is a scatter chart, showing Richmond, Rodeo, Martinez 1, Martinez 2, Martinez 3, Concord; with Year in the x-axis and ED visits per 10,000 people in the y-axis.. The x-axis shows values from 2012.7380952380952 to 2017.2619047619048. The y-axis shows values from 57.203760757314974 to 184.76623924268503.