Edit chart
Loading graph
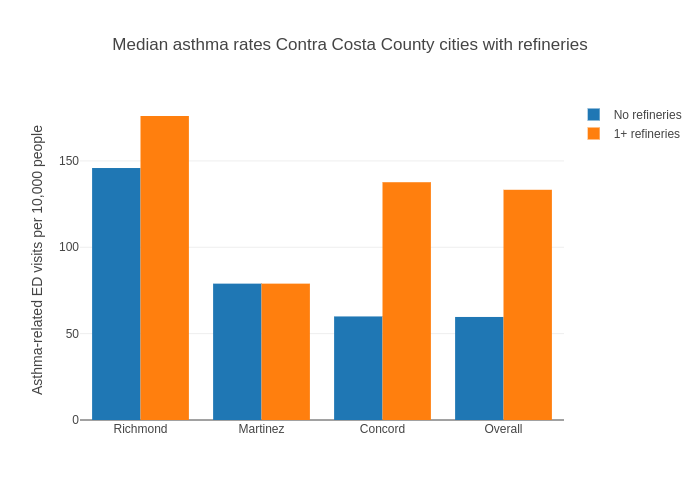
Reinarau's interactive graph and data of "Median asthma rates Contra Costa County cities with refineries" is a bar chart, showing No refineries vs 1+ refineries; with Asthma-related ED visits per 10,000 people in the y-axis. The x-axis shows values from -0.5 to 3.5. The y-axis shows values from 0 to 185.2842105263158.