Edit chart
Loading graph
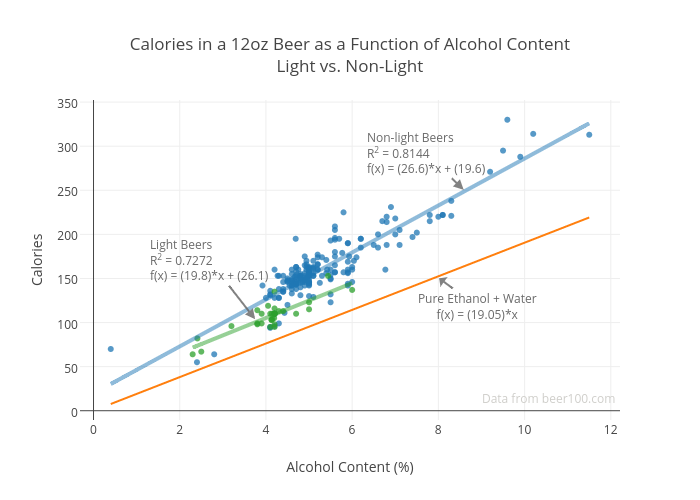
Render's interactive graph and data of "Calories in a 12oz Beer as a Function of Alcohol ContentLight vs. Non-Light" is a scatter chart, showing trace 0 - fit vs trace 2 - fit; with Alcohol Content (%) in the x-axis and Calories in the y-axis.. The x-axis shows values from -0.26890884445950525 to 12.168908844459505. The y-axis shows values from -10.42068041071607 to 350.4515678036052. This visualization has the following annotations: Non-light BeersR2 = 0.8144f(x) = (26.6)*x + (19.6); Light BeersR2 = 0.7272f(x) = (19.8)*x + (26.1); Pure Ethanol + Waterf(x) = (19.05)*x; Data from beer100.com