Edit chart
Loading graph
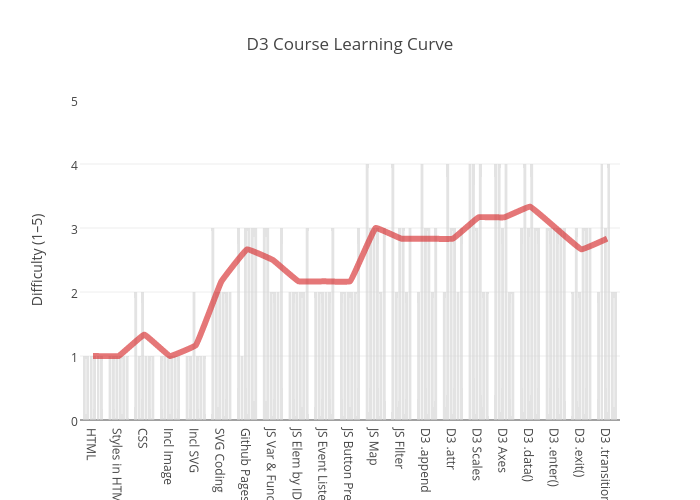
Research.bazaar's interactive graph and data of "D3 Course Learning Curve" is a bar chart, showing Col2, Col3, Col4, Col5, Col6, Col7, Avg; with Difficulty (1–5) in the y-axis. The x-axis shows values from -0.5 to 20.5. The y-axis shows values from 0 to 5.