Edit chart
Loading graph
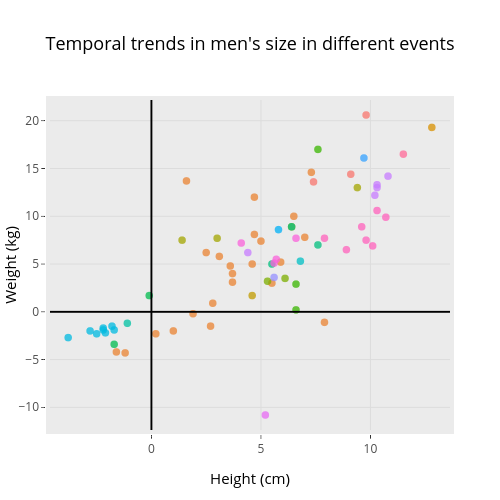
Rgriff23's interactive graph and data of "Temporal trends in men's size in different events" is a scatter chart, showing Alpine Skiing, Athletics, Basketball, Biathlon, Canoeing, Cross Country Skiing, Cycling, Diving, Fencing, Figure Skating, Football, Gymnastics, Hockey, Ice Hockey, Modern Pentathlon, Rowing, Ski Jumping, Speed Skating, Swimming, Water Polo; with Height (cm) in the x-axis and Weight (kg) in the y-axis.. The x-axis shows values from -4.63 to 13.63. The y-axis shows values from -12.37 to 22.17.