Edit chart
Loading graph
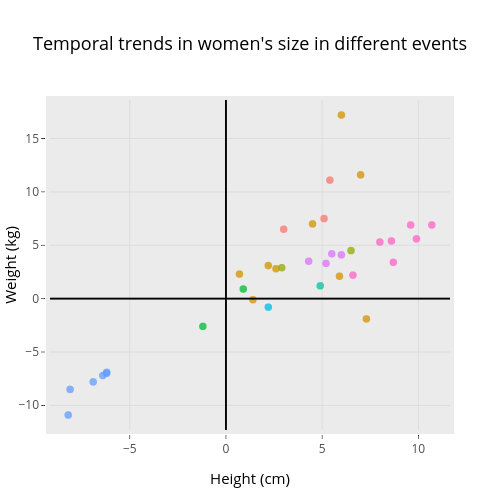
Rgriff23's interactive graph and data of "Temporal trends in women's size in different events" is a scatter chart, showing Alpine Skiing, Athletics, Canoeing, Diving, Fencing, Figure Skating, Gymnastics, Speed Skating, Swimming; with Height (cm) in the x-axis and Weight (kg) in the y-axis.. The x-axis shows values from -9.145 to 11.645. The y-axis shows values from -12.305 to 18.605.