Edit chart
Loading graph
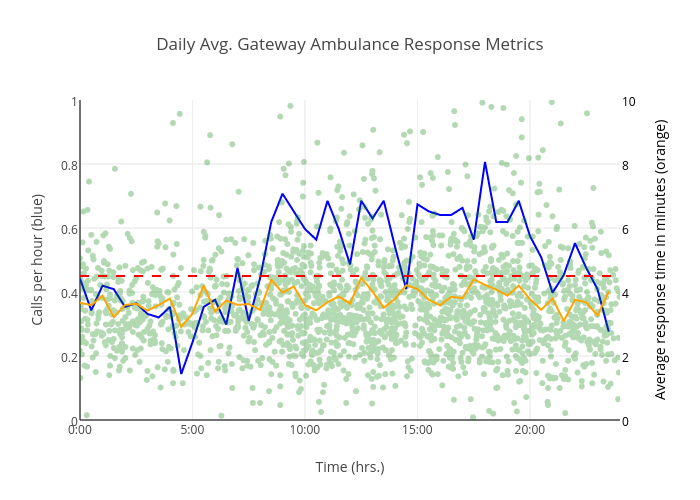
Rgtsimon's interactive graph and data of "Daily Avg. Gateway Ambulance Response Metrics" is a scatter chart, showing vs ; with Time (hrs.) in the x-axis and Calls per hour (blue) in the y-axis.. The x-axis shows values from 0 to 24. The y-axis shows values from 0 to 1.