Edit chart
Loading graph
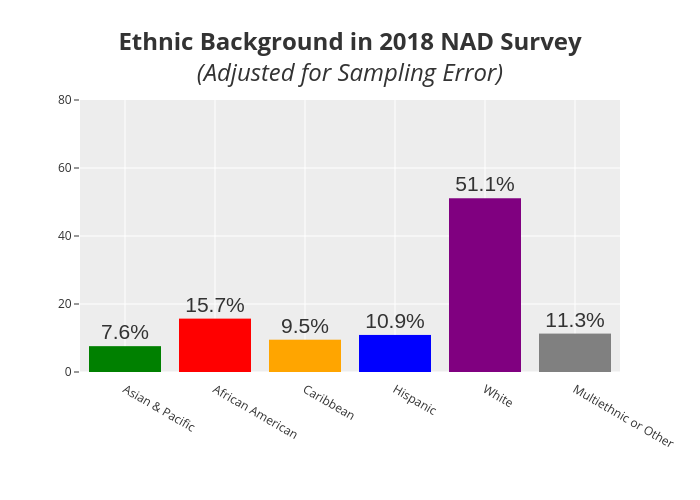
Rharrell.southern's interactive graph and data of "Ethnic Background in 2018 NAD Survey(Adjusted for Sampling Error)" is a bar chart, showing Ethnicity; with in the x-axis and in the y-axis.. The x-axis shows values from -0.5 to 5.5. The y-axis shows values from 0 to 80.