Edit chart
Loading graph
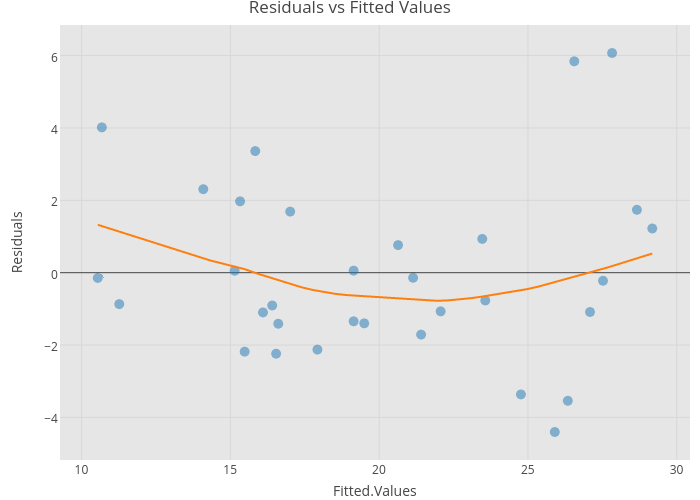
Riddhiman's interactive graph and data of "Residuals vs Fitted Values" is a scatter chart, showing Data vs Smooth; with Fitted.Values in the x-axis and Residuals in the y-axis.. The x-axis shows values from 9.395463070544535 to 30.328099178486564. The y-axis shows values from -5.13131622991089 to 6.80009701358398.