Edit chart
Loading graph
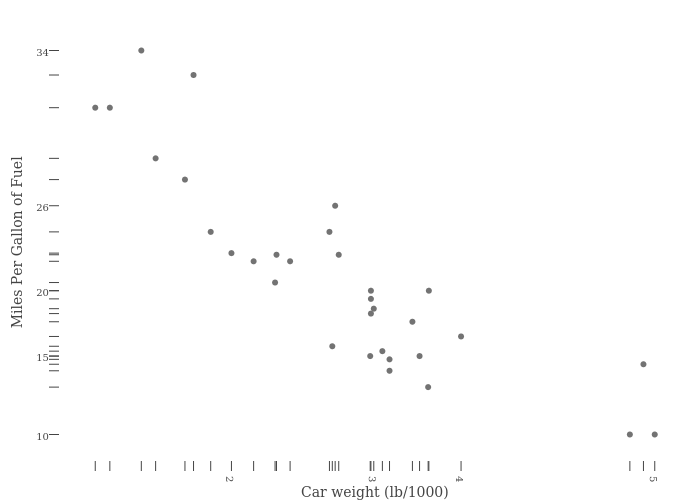
Riddhiman's interactive graph and data of "Miles Per Gallon of Fuel vs Car weight (lb/1000)" is a scatter chart, showing y; with Car weight (lb/1000) in the x-axis and Miles Per Gallon of Fuel in the y-axis.. The x-axis shows values from 1.278356670929241 to 5.658643329070759. The y-axis shows values from 8.84755421079173 to 35.45244578920827.