Edit chart
Loading graph
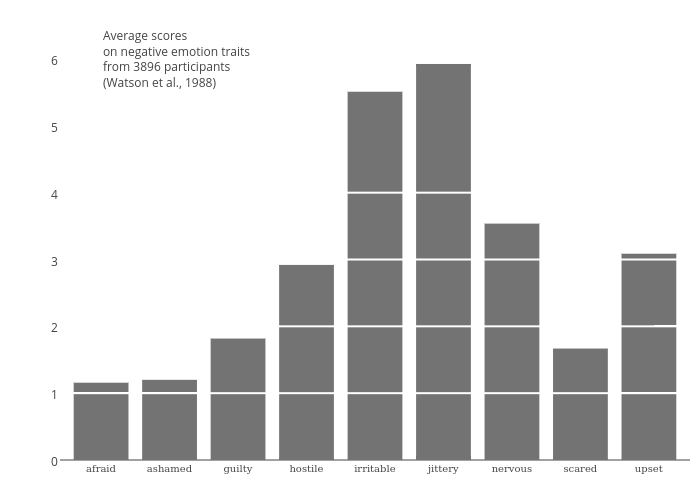
Riddhiman's interactive graph and data of "Trace 0, y vs Trace 1, y" is a bar chart, showing Trace 0, y vs Trace 1, y. The x-axis shows values from 0.4 to 9.6. The y-axis shows values from 0 to 6.491566265060241. This visualization has the following annotation: Average scoreson negative emotion traitsfrom 3896 participants(Watson et al., 1988)