Edit chart
Loading graph
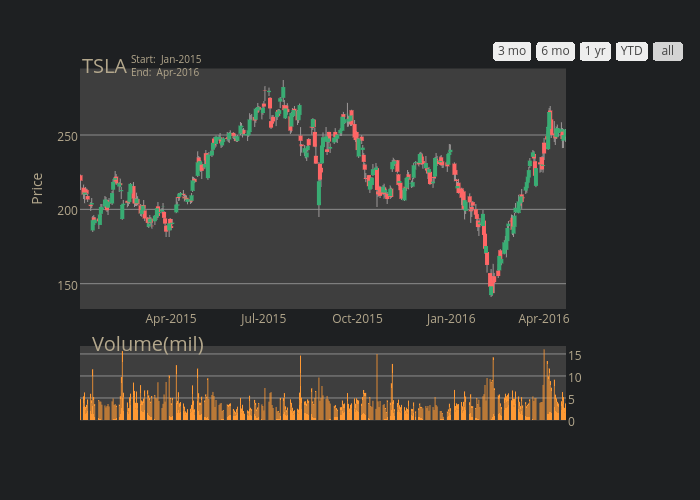
Riddhiman's interactive graph and data is a line chart; with Price in the y-axis. The x-axis shows values from 0 to 0. The y-axis shows values from 0 to 0. This visualization has the following annotations: Volume(mil); TSLA; Start: Jan-2015 End: Apr-2016