Edit chart
Loading graph
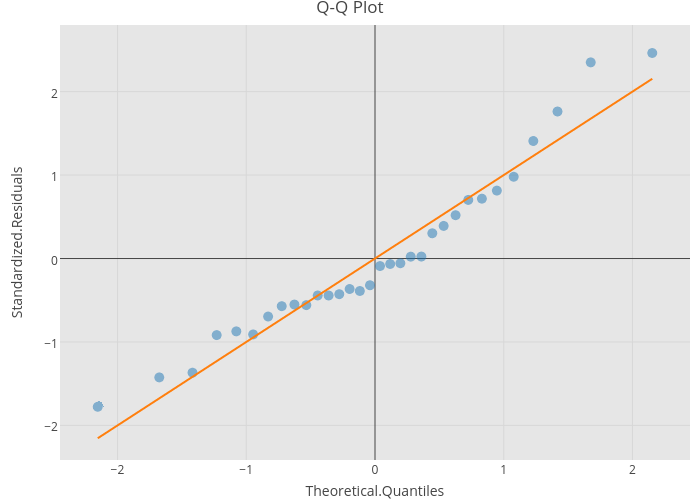
Riddhiman's interactive graph and data of "Q-Q Plot" is a scatter chart, showing Data vs ; with Theoretical.Quantiles in the x-axis and Standardized.Residuals in the y-axis.. The x-axis shows values from -2.4198253929542974 to 2.4198253929542974. The y-axis shows values from -2.4135420685003006 to 2.7798054202765154.