Edit chart
Loading graph
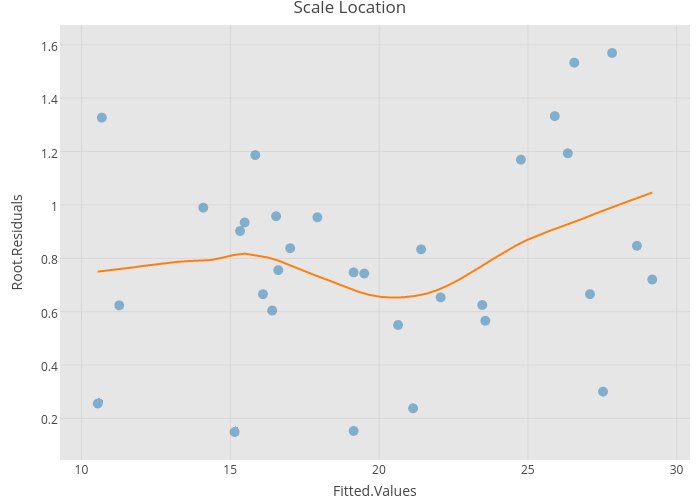
Riddhiman's interactive graph and data of "Scale Location" is a scatter chart, showing Data vs Smooth; with Fitted.Values in the x-axis and Root.Residuals in the y-axis.. The x-axis shows values from 9.395463070544535 to 30.328099178486564. The y-axis shows values from 0.050400170764388116 to 1.6680764890429889.