Edit chart
Loading graph
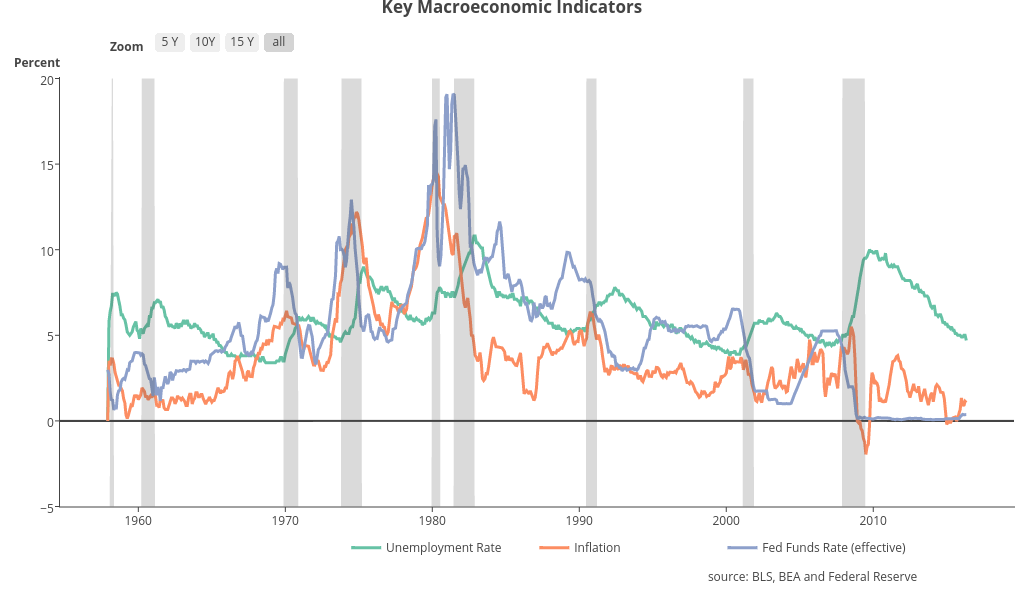
Riddhiman's interactive graph and data of "Key Macroeconomic Indicators" is a line chart, showing Unemployment Rate, Inflation, Fed Funds Rate (effective), recession. The x-axis shows values from -483802200000 to 1564453800000. The y-axis shows values from -5 to 20. This visualization has the following annotations: source: BLS, BEA and Federal Reserve; Percent; Zoom