Edit chart
Loading graph
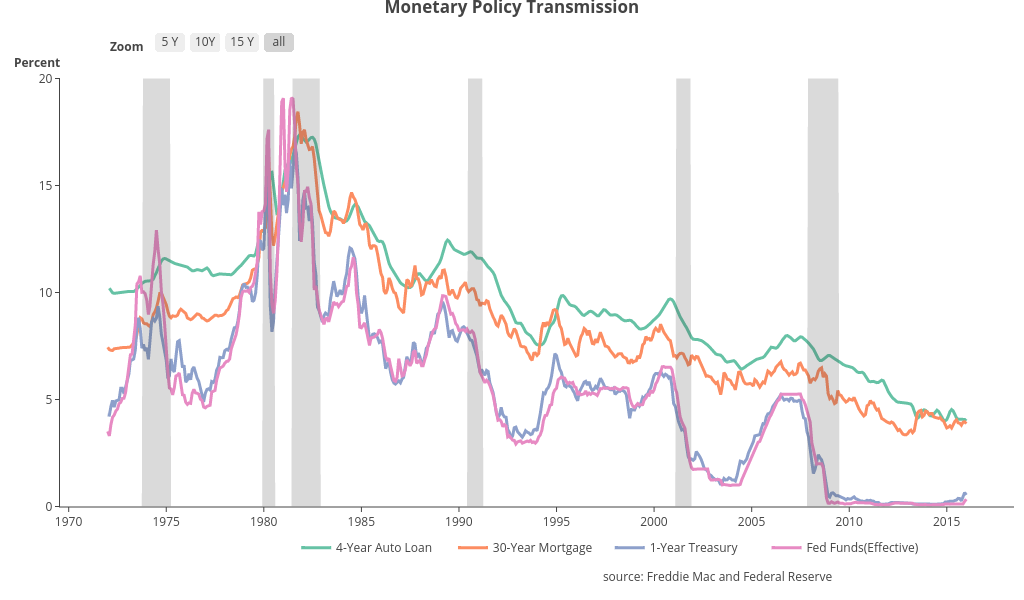
Riddhiman's interactive graph and data of "Monetary Policy Transmission" is a line chart, showing 4-Year Auto Loan, 30-Year Mortgage, 1-Year Treasury, Fed Funds(Effective), trace 5. The x-axis shows values from 1320188951.0329819 to 1513318611048.967. The y-axis shows values from 0 to 20. This visualization has the following annotations: source: Freddie Mac and Federal Reserve; Percent; Zoom